What is the ‘case’ is a powerful idea. The ‘case’ is physical reality, at some moment in time or space. It is absolute reality, a platonic ideal we deduce from out sensory experience.
Blind men and the elephant

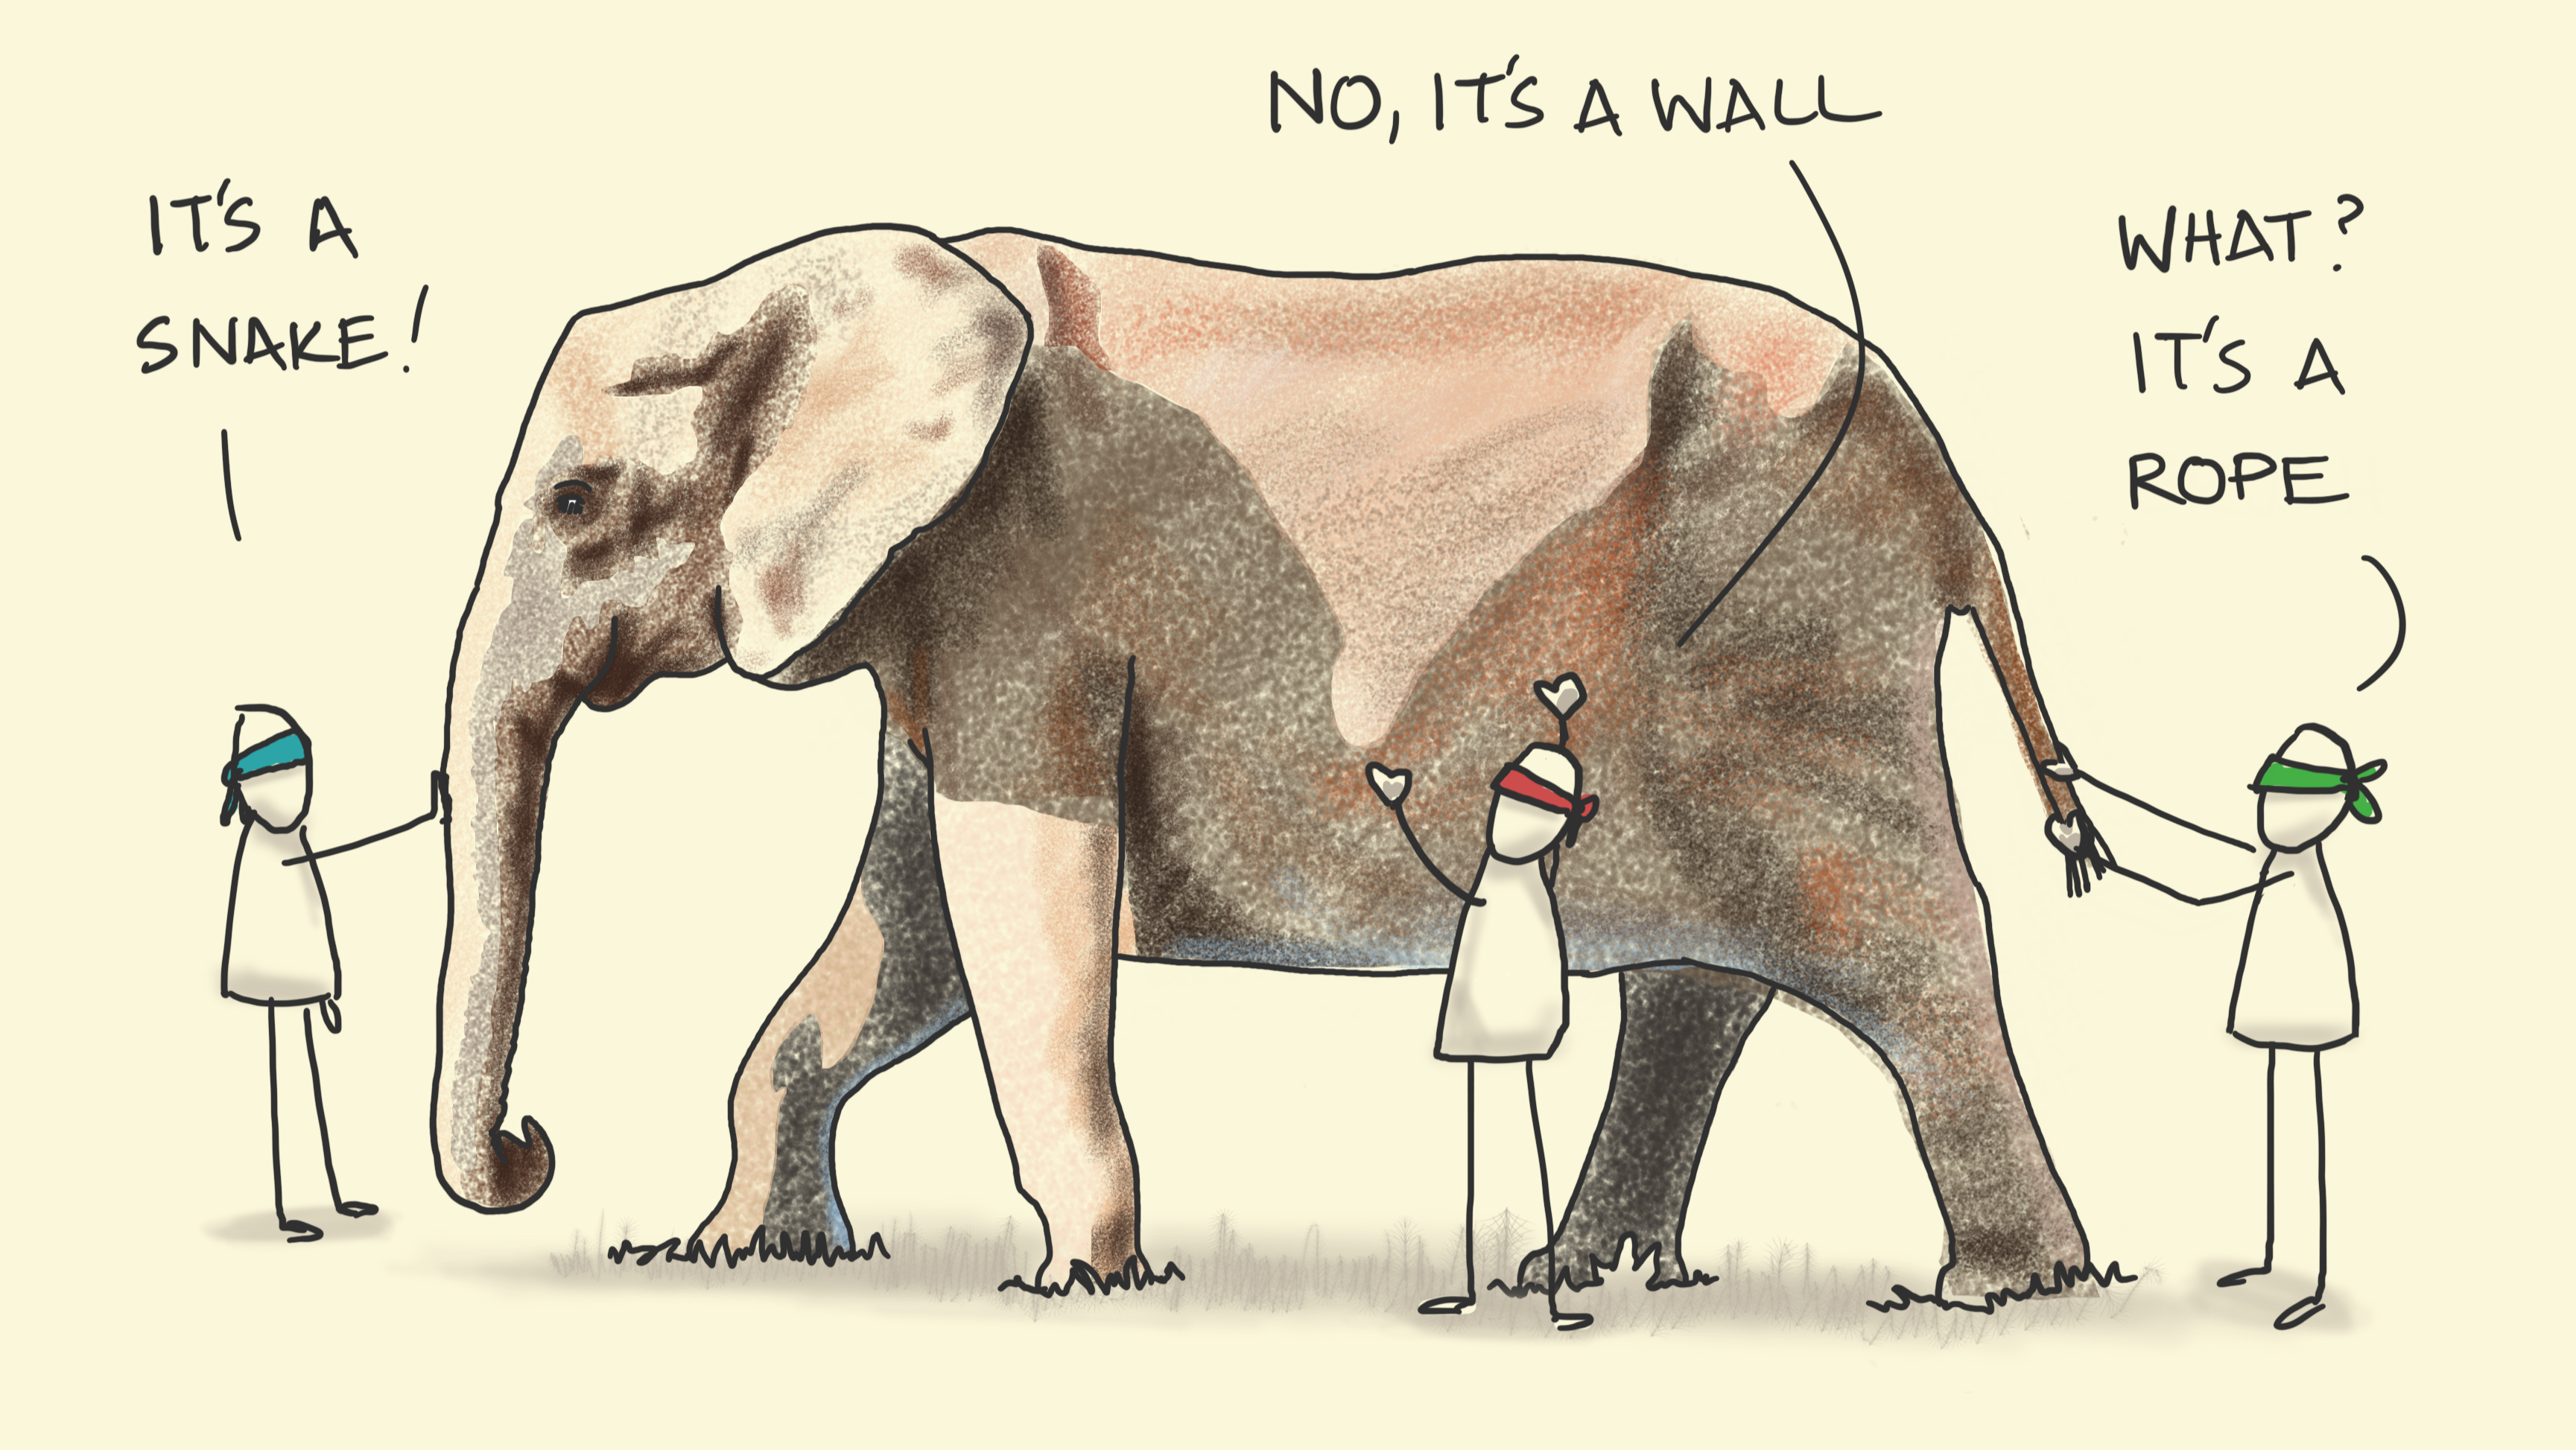
My intuitive feeling for what is the ‘case’ is best summarised by the parable of the blind men and the elephant. Several blind men encounter an elephant for the first time and attempt to understand what it is by touching different parts of its body.
Each blind man touches a different part of the elephant—the trunk, the tusks, the ears, the legs, and the tail—and based on their limited experience, they come to vastly different conclusions about what the elephant is like. One might describe the elephant as like a snake (feeling the trunk), another might say it’s like a spear (feeling the tusks), while another might say it’s like a fan (feeling the ears), and so on.
What is Statistics?
Statistics is applied philosophy of science.
The application of our understanding of how to establish patterns about reality and put a measure of certainty on the existence of such a pattern in nature.
Data is the The raw material of statistics. Where evidence is defined as “the available body of facts or information indicating whether a belief or proposition is true or valid.” data is:
nature’s evidence, seen through the lens of a measuring instrument.
Data takes the form of numbers. Numbers lack ambiguity. They have one property: their value.
Imagine you are one of the blind men from the parable above. How would you describe what you feel to the other blind men? You feel a smooth surface, how smooth? How might another blind man compare the smoothness he feels with what I feel without touching the same part?
What might emerge is a common unit of measure, another object to compare it to and say: “Touch the wall [or anything all me can touch] its about that smooth, maybe a little more, maybe a little less”. What would eventually happen is that smoothness and roughness would take on numerical approximations to this common measure.
Statistical Model (informally)
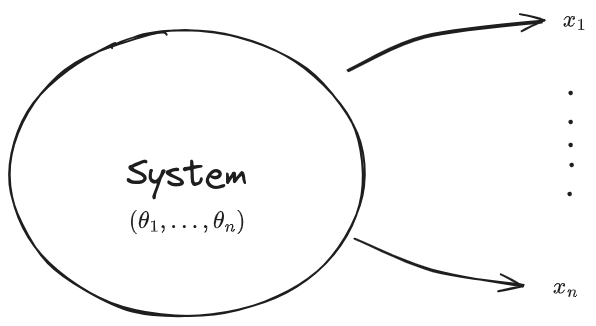
All science relies on a reduction, or simplification of reality. This simplification is referred to as a system. It could be two billiard balls, the atmosphere of the planet or a neutron star. Its a portion of reality under study.
If the system was the elephant. The data about the system is in the form of sensory experience with the blind men. All the blind man come up with what they think the elephant is based on this data. Each blind man comes up with a model of what they’re touching.
Imagine that each man only measured one property, roughness, and had a super accurate way to do so, such that we translate each measure of roughness to a number on some scale. If all the possible models each man could come up with is just an animal defined purely by a roughness measure, the task becomes to associate the data measured by the men with a given animal/model. To compare the roughness measured with what we know the roughness of each model (animal) to be. We want to match the collected information to the animal (model).
This matching process is uncertain. We can’t be 100% sure that even if all the measurements by the men matches the roughness of an elephant that its definitely an elephant but statistics provides methods to quantify how sure we are.
Statistical Model (formally)
A statistical model has to connect two distinct conceptual entities: data, which are elements x of some set (such as a vector space), and a possible quantitative model of the data behavior. Models are usually represented by points θ 1.

If we classified each animal above as a vector of points and the collection of these animals as a vector of vectors θ. We consider the data as a vector x⃗ = [x1,...,xn]. The goal is to define a function Λ(x,θ) that assigns a numerical value, or measure, quantifying the relationship between that data and a given model point (θ1,...,θn) (which is the ‘system’ in the above diagram). This value would be higher if the data more closely aligned with a point in θ (an animal) and lower if it doesn’t seem related.
Pinning down reality
One of my biggest inspirations is Carl Sagan. I read his work, the ‘Demon Haunted World’ in my teens. I wanted to explore the supernatural, to become ‘excited’ about reality. Reality as defined by science was boring and banal. Anyone whose read the book will see the irony of this goal. Sagan dismantles lots of notions of the supernatural in this book but maintains the validity of claims of the supernatural without the scientific method. The subtitle of the book: ‘Science as a candle in the dark’ summarises Sagan’s views of Science as a set of methods to keep us from fooling ourselves. Sagan pushes for humility but rigour in how science should be perceived in our culture.
In April of 2023 I started to self-study John Tsitsiklis’ course on probability from MIT Opencourseware 2. Tsitsiklis’ approach was to provide rigour as well as general practical application. What fascinated me was that when intuitive explanations didn’t work I would just try and learn the formulas, to get a sense of the notation and symbols. This was the mathematical object that described the phenomenon. No matter the ‘intuition’ you came up with to describe it, you could never truly say more or less than the mathematical notation.
As is quite obvious, reducing an animal to a set of numbers seems inhuman and wrong. This constraining of reality is reductionism. Breaking something complex like an animal down into what are its essential parts for differentiating it in reality. This is primarily so we can be unambiguous about what an elephant is, so that my idea of an elephant is the same as yours. To truly understand reality we have to remove our perception from obfuscating it.
To make correct decisions, to strive for a better world requires having the best model of reality possible both for its own sake and for having accurate information to make informed decisions. Beauty and empathy for reality and its constituents (us) can be maintained in this regime. Balancing both is essential for tackling problems with multiple stakeholders, with no right answer but whose answer must be some sort of compromise.